How off were the polls this time round?
The dust hadn’t even settled on Sunday evening, and prognosticators already started debriefing the apparent “polling miss”, all seemingly settling on the vote of the “undecideds” as being the cause. But let’s take a step back and see just how far off they were in the first place.
I collected public polling published in the last 2 months. The solid line is 1st count party vote share for the MEP elections: often the thing polls are implicitly asking.
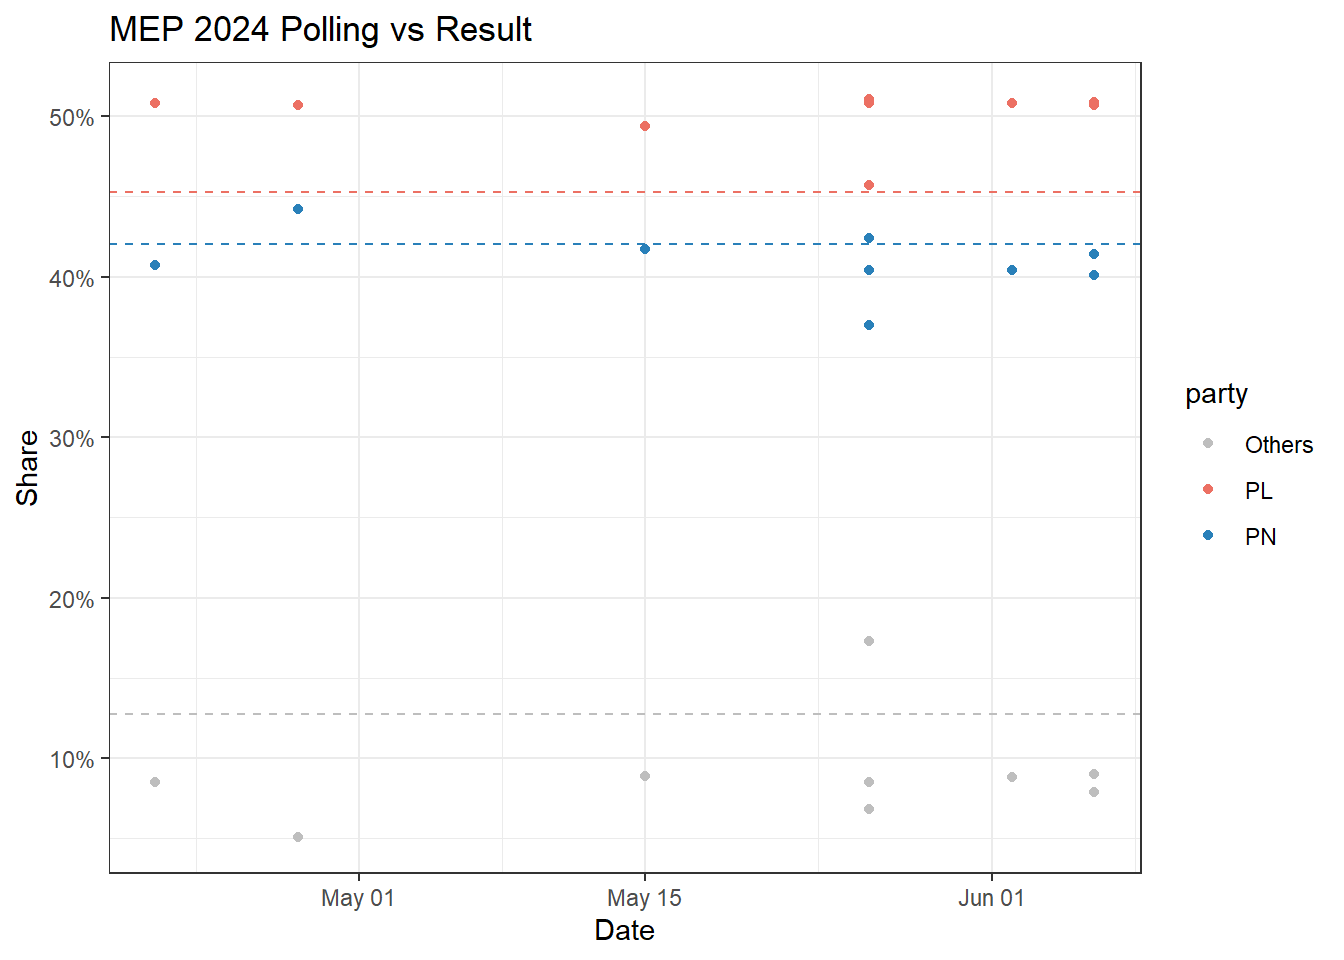
The most obvious thing here is that while polls underestimated the PN vote slightly, they overestimated the PL and underestimated the Other party votes to greater degrees. On average:
## # A tibble: 3 × 2
##   party  mean_error
##   <chr>       <dbl>
## 1 Others       4.76
## 2 PL           4.84
## 3 PN           1.67
We can also look at how this compares to historic polling error since calculating this is an integral step of the election forecasts.
The solid line is the median polling error for the 2013, 2017, and 2022 GE cycles, as a function of days until election. The points are the equivalent error from polls this cycle on that respective day until election.
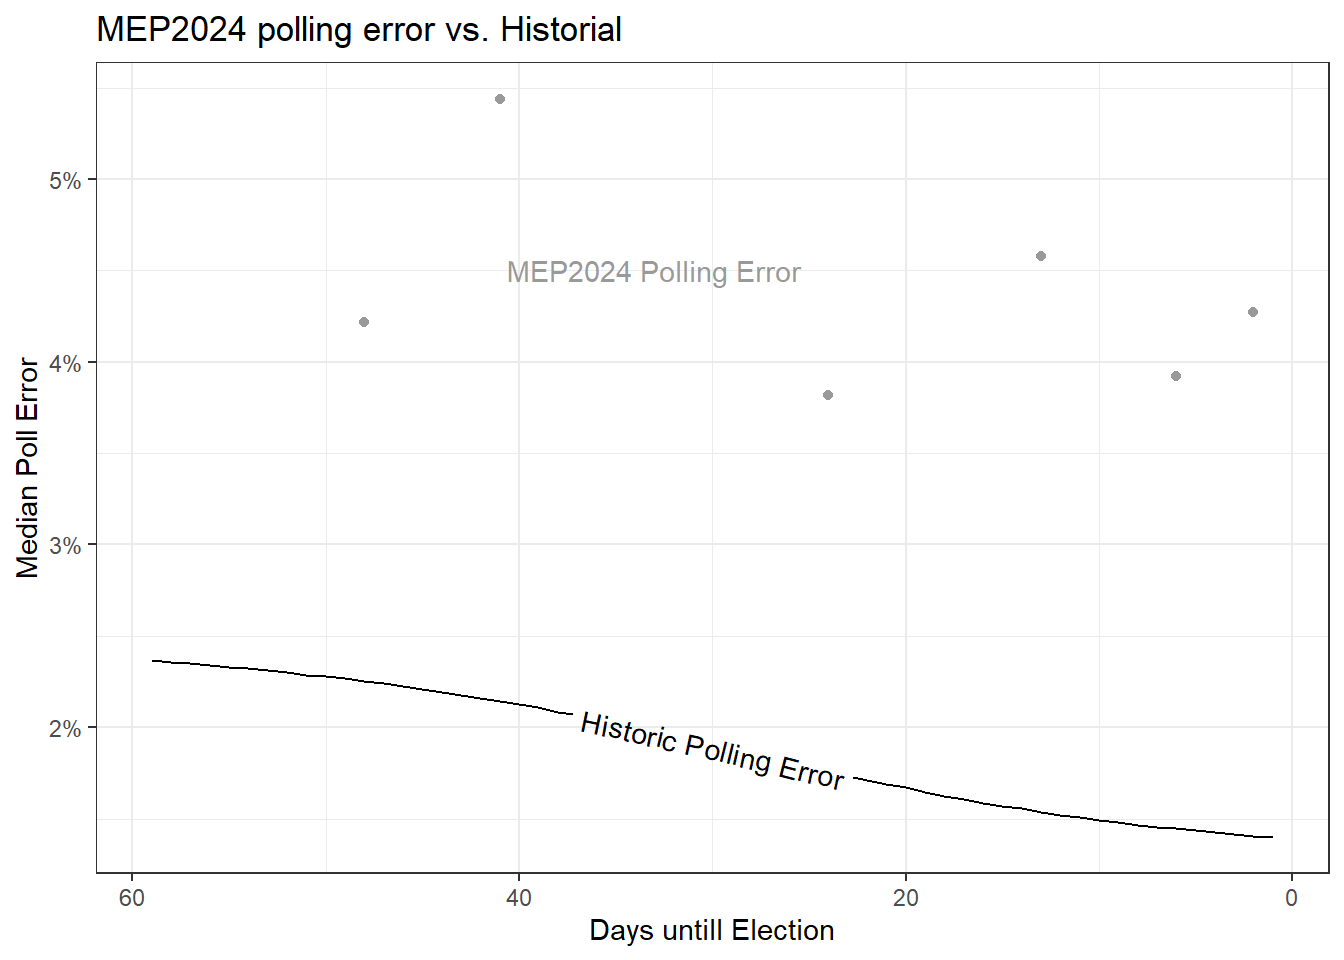
Plotting them out this way two things become apparent:
the magnitude of the fluke relative to the historical context.
the fact that error was constant and did not decrease the closer we got to the election.
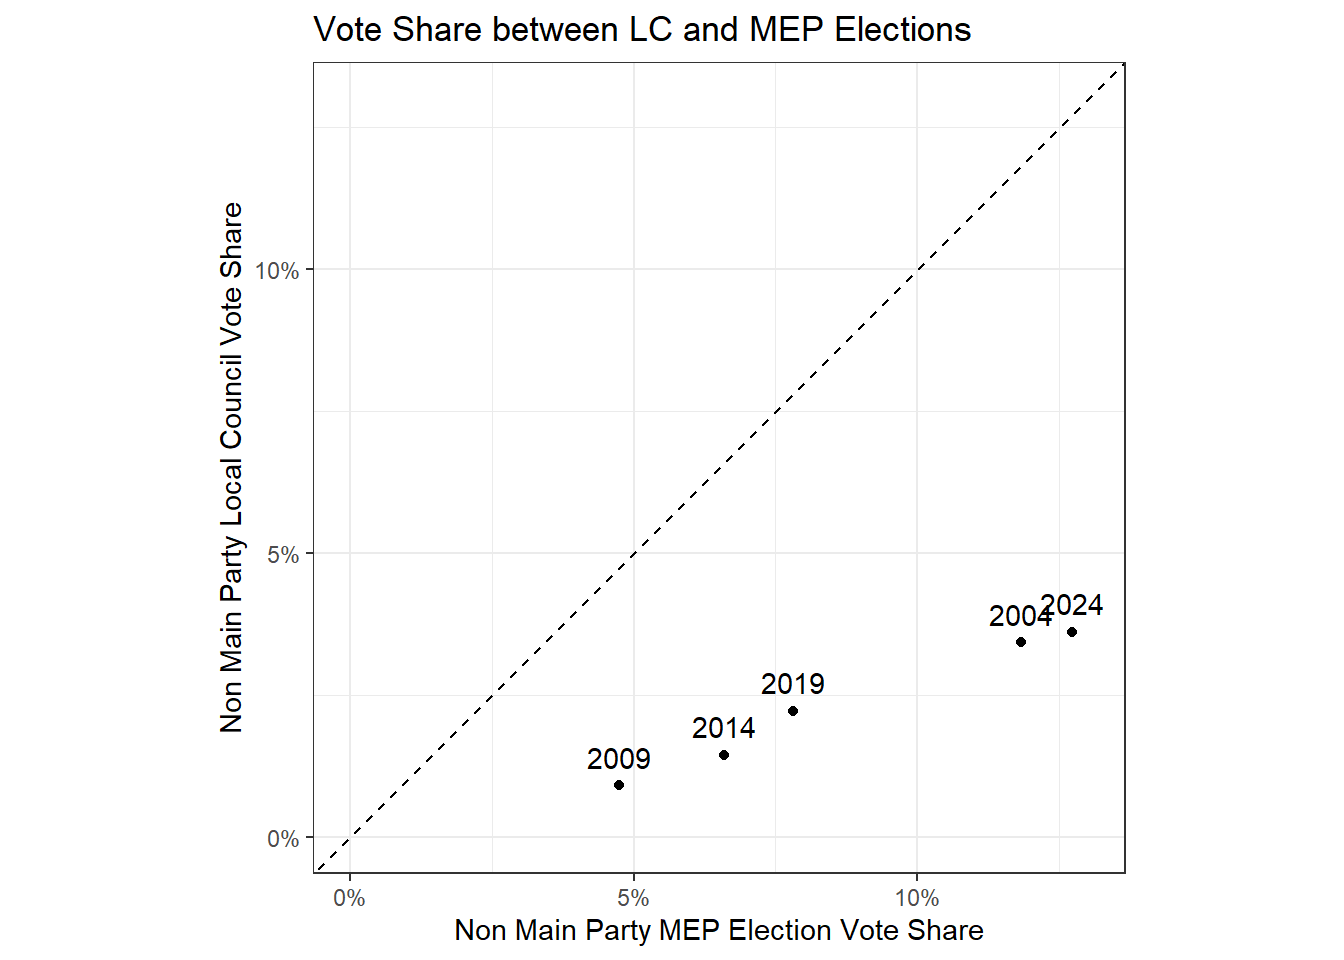
I think in thinking of what went wrong, there are a few things to keep in mind. Firstly, MEP elections are weird, both here and in the rest of Europe. In many countries traditional parties struggle to do well sometimes, while greens and more extremist movements on both sides tend to get a boost.
We can see this here too, by plotting the non PN/PL percentage share in MEP elections against their respective Local Council share in the same year. Anything on the diagonal means an equal share in both MEP and LC elections. Anything under the line means third parties win a greater share of votes in MEP elections than Local Council ones, as is the case.
But it also is the case that this MEP election was doubly weird, and not just weird in a General Election vs Local Election sort of way. Taking the same idea as above, we can plot PL vote share in Local Council elections vs. MEP ones (I chose PL share because intuitively it seems more stable and less impacted by third parties contesting/not contesting).
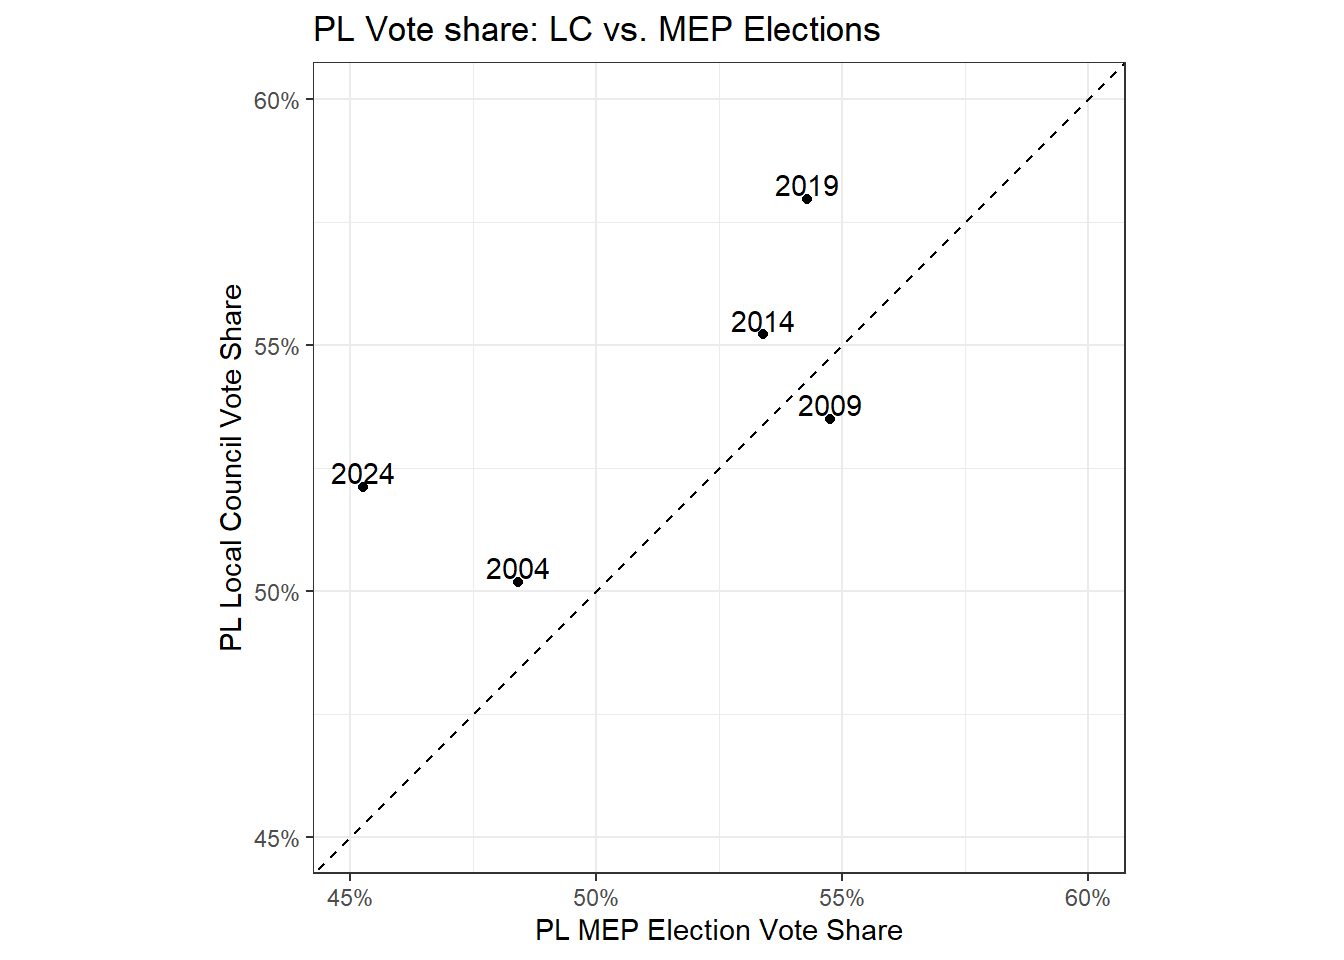
Again, anything on the dashed diagonal means a perfect 1:1 relationship, as is often roughly the case: e.g. in 2009 PL won 55% of the vote in the MEP election and 53% of the vote in the Local council elections. 2024 was an outlier year in that respect: for some reason PL did exceptionally worse in the MEP election but somehow managed to hold on for the local council elections.
All the above aside, I also don’t think the people answering ‘undecided’ on polls were the main problem.
Firstly, I’m not sure using the percentage of people saying they’re not going to vote as an estimate for turnout is the right way. It might be arguable that when you frame the question along the lines of ‘if an election were to take place tomorrow’ people answering ‘not voting’ are the bulk of the no shows, but people can have strong political opinions and not show up to vote. They can also simply answer ‘not voting’ because they don’t want to answer the poll and ‘I don’t want to say’ strikes them the wrong way. I think this can be much more elegantly answered with a ‘how probable are you to vote’ Likert scale.
Secondly, and relatedly, I think the more pertinent story here is the fact that turnout for all those previous elections we have polling for has always been relatively high, while this time round it was low by Maltese standards. There just might be a mismatch for public sentiment and people who go out to vote in an MEP election. Without modeling or having assumptions for which sort of voter shows up to vote, you are essentially assuming an equal probability for everyone. It’s likely that that is not the case, and it has never been the case in some countries, which is why pollsters there have turnout models precisely for this reason.
Lastly, I’d caution against putting some pollsters on a pedestal and unduly chastising others. The simple fact of the matter is there is no secret sauce. To paraphrase something I read once, being decent in statistics is largely analogous to being decent in life: you do the best you can with what you know, you read a lot to get better, and you revisit those assumptions often, especially when you are presented with evidence to the contrary. Polling is much the same, there is no magic crystal ball involved, and it remains a discipline firmly rooted in the scientific method.